Social Media
Overall Usage


Multiple Answers n=1911
Source: Telephone Survey (2019)
Social Media User Profile
The use rate of communication software was more 90% and more, without much difference between by sex or by age.
The use rate of social media is at 80%, with those aged 12 to 39 and 45 to 49 having a higher use rate than other ages.
Multiple Answers n=1911
Source: Telephone Survey (2019)
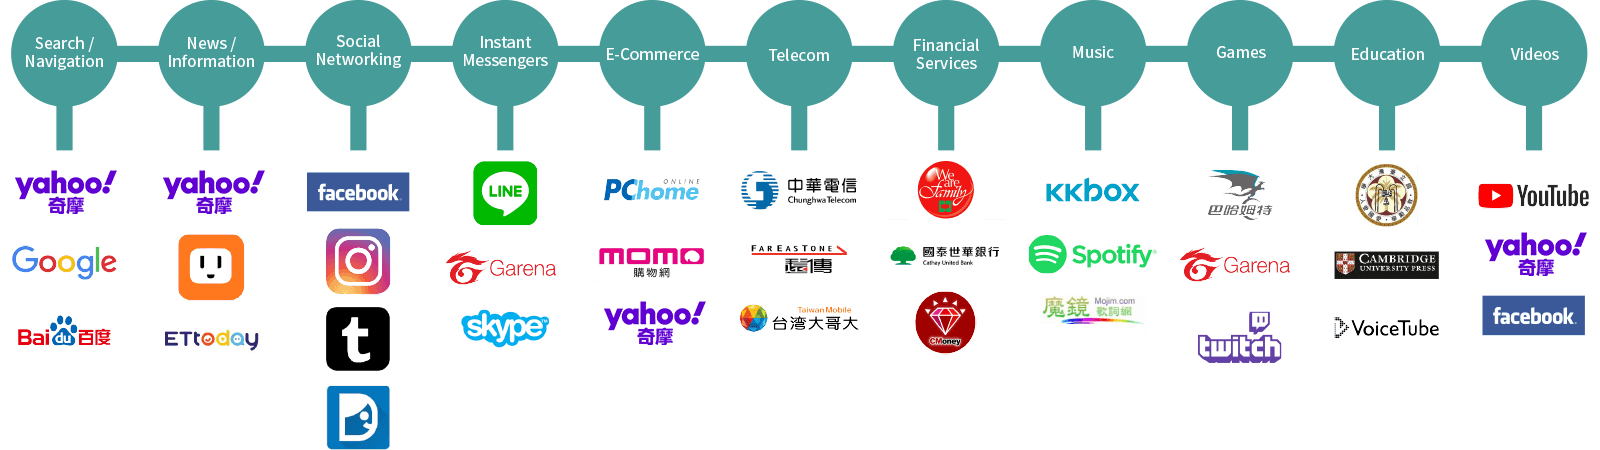
Usage Rate of SNS Brands
98.9% of respondents use Facebook, and Instagram comes second at 38.8%, with higher use rates in the 12 to 34-year-old age group. Use rates for other social media platforms is less than 10%.
Multiple Answers n=1514
Source: Telephone Survey (2019)
Entertainment Applications
Content Media

Listen to Music, Watch TV Shows, Movies or Livestreams
n=1911

n=1615
Source: Telephone Survey(2019)
Content Media User Profile
Media content such as videos and livestreams have a use rate of 84.5%. The use rate is inversely proportional to age.
Multiple Answers n=1911
Source: Telephone Survey (2019)
Preferred Categories
- The highest proportion of respondents, at 76.3%, watch Taiwan-made content, with those aged 12 to 19 and 30 to 39 having relatively higher proportions.
n=1460
Source: Telephone Survey (2019)
- 64.8% said they watched "Dramas and serials". Women, those aged 30 to 39, 50 to 54, and 60 to 64, as well as mobile-only users were more likely to watch dramas and serials than other groups. In second place, 24.2% watched "News", with those aged 50 to 54 and those older than 65 having higher proportions.
n=1434
Source: Telephone Survey (2019)
Online Games

n=1911

n=854
Source: Telephone Survey(2019)
Online Games User Profile
44.7% had played "Online games". Men had a higher rate of use than women, and those aged 12 to 34 and mobile-only users also had a higher use rate.
n=1911
Source: Telephone Survey (2019)
Economy Driven
E-commerce

n=1911

n=1177
Source: Telephone Survey (2019)
Online Shopping Factors


Multiple Answers n=1246
Source: Telephone Survey(2019)
Online Shopping Concerns
The highest proportion of respondents who shop online are concerned that "Products do not match images", with 47.7%. Those aged 12 to 19 and 55 to 59 were more likely to have this concern. 32.3% are "Worried about scams", with those aged 50 to 54 more likely to have this concern.
Multiple Answers n=1246
Source: Telephone Survey (2019)
Mobile Payments

n=1911


n=479
Source: Telephone Survey (2019)
Mobile Payment User Profile
Mobile payment use rate is 25.0%, with higher use rates among those aged 20 to 39 and 45 to 49, mobile-only users, and those living in the Northern region.
Multiple Answers n=1911
Source: Telephone Survey (2019)
Mobile Payment Brand Market Share
50.8% use "LINE Pay", with women and those aged 20 to 29 using it more. Apple Pay came second with 41.7%, and a higher use rate among those aged 20 to 34, and mobile-only users.
Multiple Answers n=479
Source: Telephone Survey (2019)
Information Applications
E-books

n=1911

n=1150
Source: Telephone Survey (2019)
Online Learning

n=1911

n=1547

n=364
Source: Telephone Survey (2019)
Smart Home


n=2134
Source: Telephone Survey (2019)
Smart Home Use Overview
Smart home use rate is at about 20%, and about 60% intend to use it in the future. Smart anti-burglary had the highest use rate and intention of use in the future.
n=2134
Source: Telephone Survey (2019)
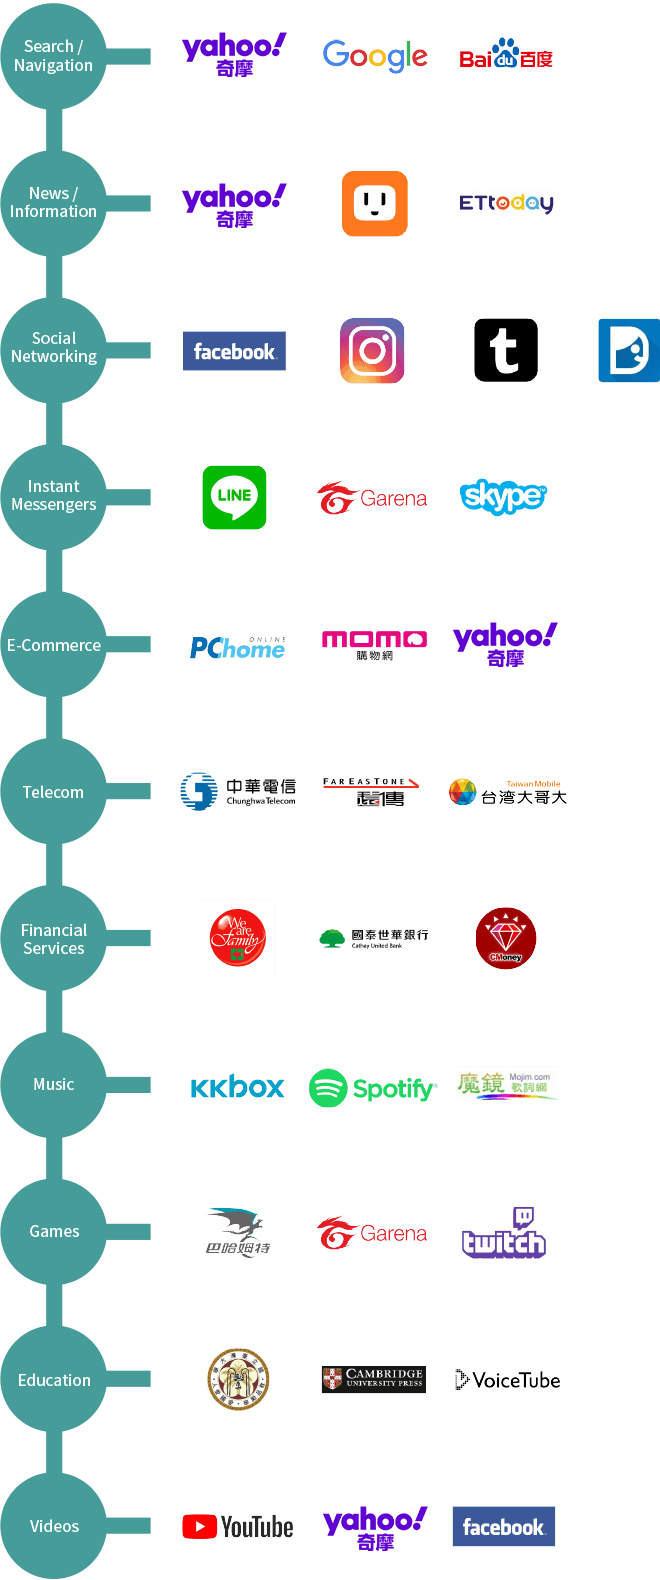
Key Online Brands in Taiwan
Global Internet Competitiveness
According to the Swiss World Economic Forum (WEF), in "The Global Competitiveness Report 2019," Taiwan ranked 12th among the 141 countries evaluated.Taiwan ranks 11th in terms of its use of information technology, while "overall economic stability" and "innovation capability" rank first and fourth, respectively.
| Key indicators | |
| Population (millions) | 23.6 |
| GDP per capita(US$ ) | 24,971.4 |
| GDP (PPP) % world GDP | 0.93 |
| Competitive performance | Penetration % | Rank (Out of 141) |
| Global ranking | 80 | 12 |
| Use of communication technology | 82.3 | 11 |
| 1.Mobile communication (per 100 people) | 123.7 | 55 |
| 2.Mobile broadband (per 100 people) | 110.0 | 23 |
| 3.Fixed broadband (per 100 people) | 24.1 | 46 |
| 4.Optical network (per 100 people) | 15.3 | 16 |
| 5.Personal Internet access (adults) | 92.8 | 14 |
| Competitiveness performance of six east Asian countries | Global Ranking | ICT uses rankings |
| Taiwan | 12 | 11 |
| South Korea | 13 | 1 |
| Hong Kong | 3 | 3 |
| Singapore | 1 | 5 |
| Japan | 6 | 6 |
| China | 28 | 18 |
Source: National Development Council、National Development Council Press Release、World Economic Forum (2019)
Social Media Use Rate/Usage Time
Among Asian regions, Taiwan ranks first in terms of social media usage. Other than India, social media use in Asia exceeds the global average. Taiwanese netizens spend an average of 1 hour 51 minutes on social media daily, which is lower compared to other Asian countries, and less than two hours like in Japan and South Korea.
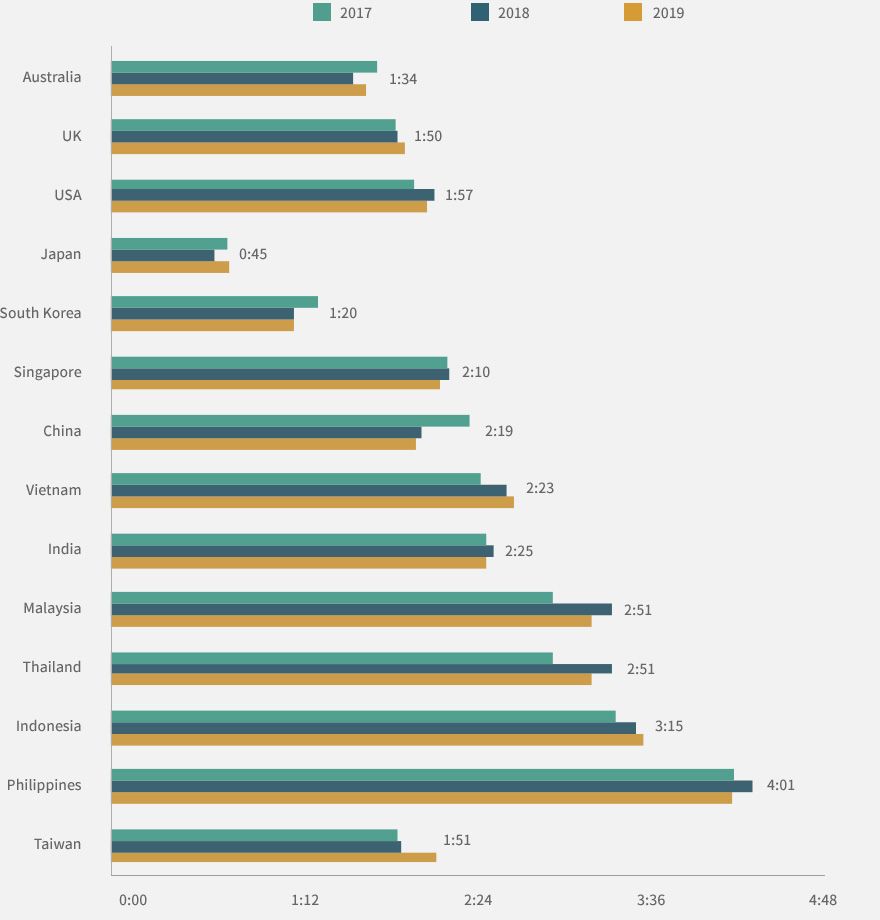
Source: The latest social media trends to know in 2019 (Global Web Index,2019)
This graph shows Taiwan's Internet use rates from an international source. As the research methods differ from this paper's, it should be used as a reference for ranking only.
Source: Digital 2019 (We are social, 2019)